Miami Condo Market Report — July 2026: Prices, Inventory & Days on Market
Miami-Dade condo market data for July 2026: median close price $400K (+3.9% YoY), $393/sq ft, 95.2% sale-to-list, and 18.3 mo of inventory — drawn from live MLS closings.


Miami Condo Market Report — July 2026
The Miami-Dade condo market data below is drawn from closed MLS sales as of July 22, 2026 — the same live dataset that powers our Miami condo market dashboard, updated daily. All figures are medians across a trailing 90-day window unless noted. Month-over-month comparisons begin in an upcoming issue as our daily tracking baseline matures; year-over-year figures are shown where available.
Miami-Dade Condo Snapshot
| Metric | July 2026 | YoY |
|---|---|---|
| Median close price | $400K | +3.9% |
| Median $/sq ft | $393 | +2.3% |
| Sale-to-list ratio | 95.2% | −0.2% |
| Median days on market | 145 | — |
| Months of inventory | 18.3 mo | — |
| Active listings | 16,794 | — |
| Closed sales (trailing 90d) | 2,759 | +38.2% |
What the Numbers Say
The metro median condo closed at $400K (+3.9% YoY), at $393/sq ft. Sellers received a median 95.2% of list, and homes took a median 145 days to sell.
At 18.3 mo of inventory and a median 145 days on market, Miami-Dade condos sit firmly in buyer's-market territory — sellers are competing on price.
Active inventory sits at 16,794 condos. For buyers, more inventory and longer days on market mean more negotiating room; for sellers, it means pricing to the comps matters more than ever.

Most Expensive Neighborhoods by Price per Sq Ft
Median closed $/sq ft across neighborhoods with at least 5 closed sales in the trailing window, highest first.
| Neighborhood | Median $/sq ft | Median price | Sales (90d) |
|---|---|---|---|
| Fisher Island | $1,953 | $7.4M | 7 |
| South of Fifth | $1,797 | $2.5M | 16 |
| Coconut Grove | $1,034 | $1.71M | 52 |
| Bal Harbour | $980 | $1.7M | 21 |
| Key Biscayne | $873 | $1.42M | 51 |
| Bay Harbor Islands | $757 | $928K | 32 |
| Venetian Islands | $734 | $820K | 13 |
| Surfside | $707 | $1.12M | 14 |
| Edgewater | $670 | $733K | 106 |
| Sunset Islands | $633 | $1.65M | 5 |
| Brickell Key | $629 | $675K | 31 |
| Brickell | $616 | $618K | 154 |
Methodology
Figures are medians computed from closed Miami-Dade MLS condo sales over a trailing 90-day window, plus active-listing counts captured daily. Neighborhood rankings exclude areas with fewer than 5 closed sales in the window to avoid small-sample noise. Month-over-month and year-over-year compare against the nearest snapshot ~30 and ~365 days prior. Explore the live, daily-updated figures — including any neighborhood — on the Miami condo market dashboard.
This report is for informational purposes. Medians describe the market as a whole and may differ from any individual transaction. Data is sourced from the MLS and is deemed reliable but not guaranteed.
Tags
Related Articles
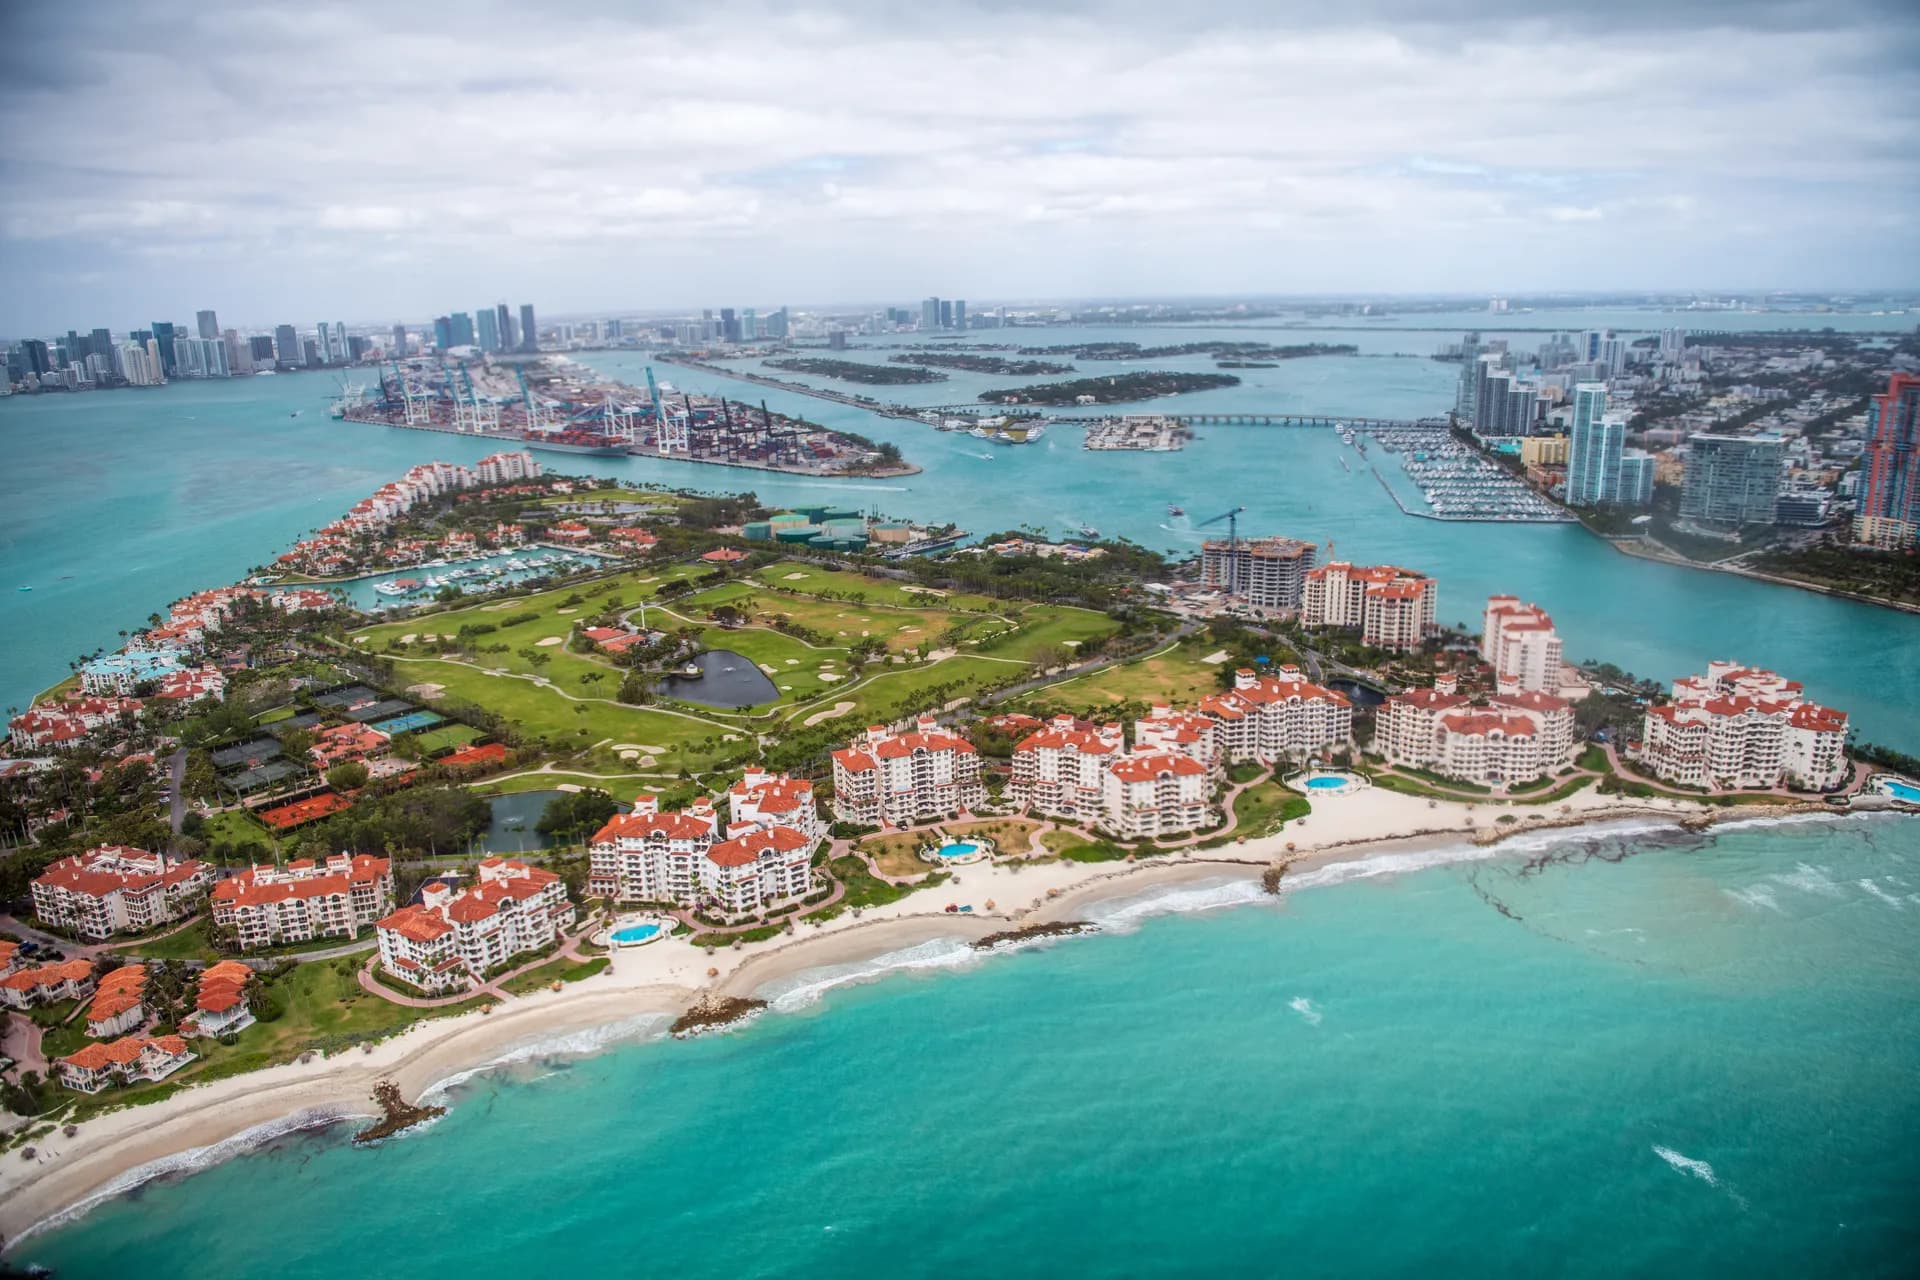
Fisher Island Condos: What $4M, $11M and $22M Buy
At $10.9M and $21.9M, two Palazzo listings ask almost the same price per square foot. Compare them with a $3.75M Bayside two-bedroom.
Miami Market Report — June 2026: Trophy Neighborhoods, Condo & Home Price Trends
A data-driven mid-2026 look at Miami's trophy neighborhoods — median price per square foot, year-over-year trends, and buyer-vs-seller conditions across Fisher Island, South of Fifth, Brickell, Coconut Grove, Key Biscayne and more.
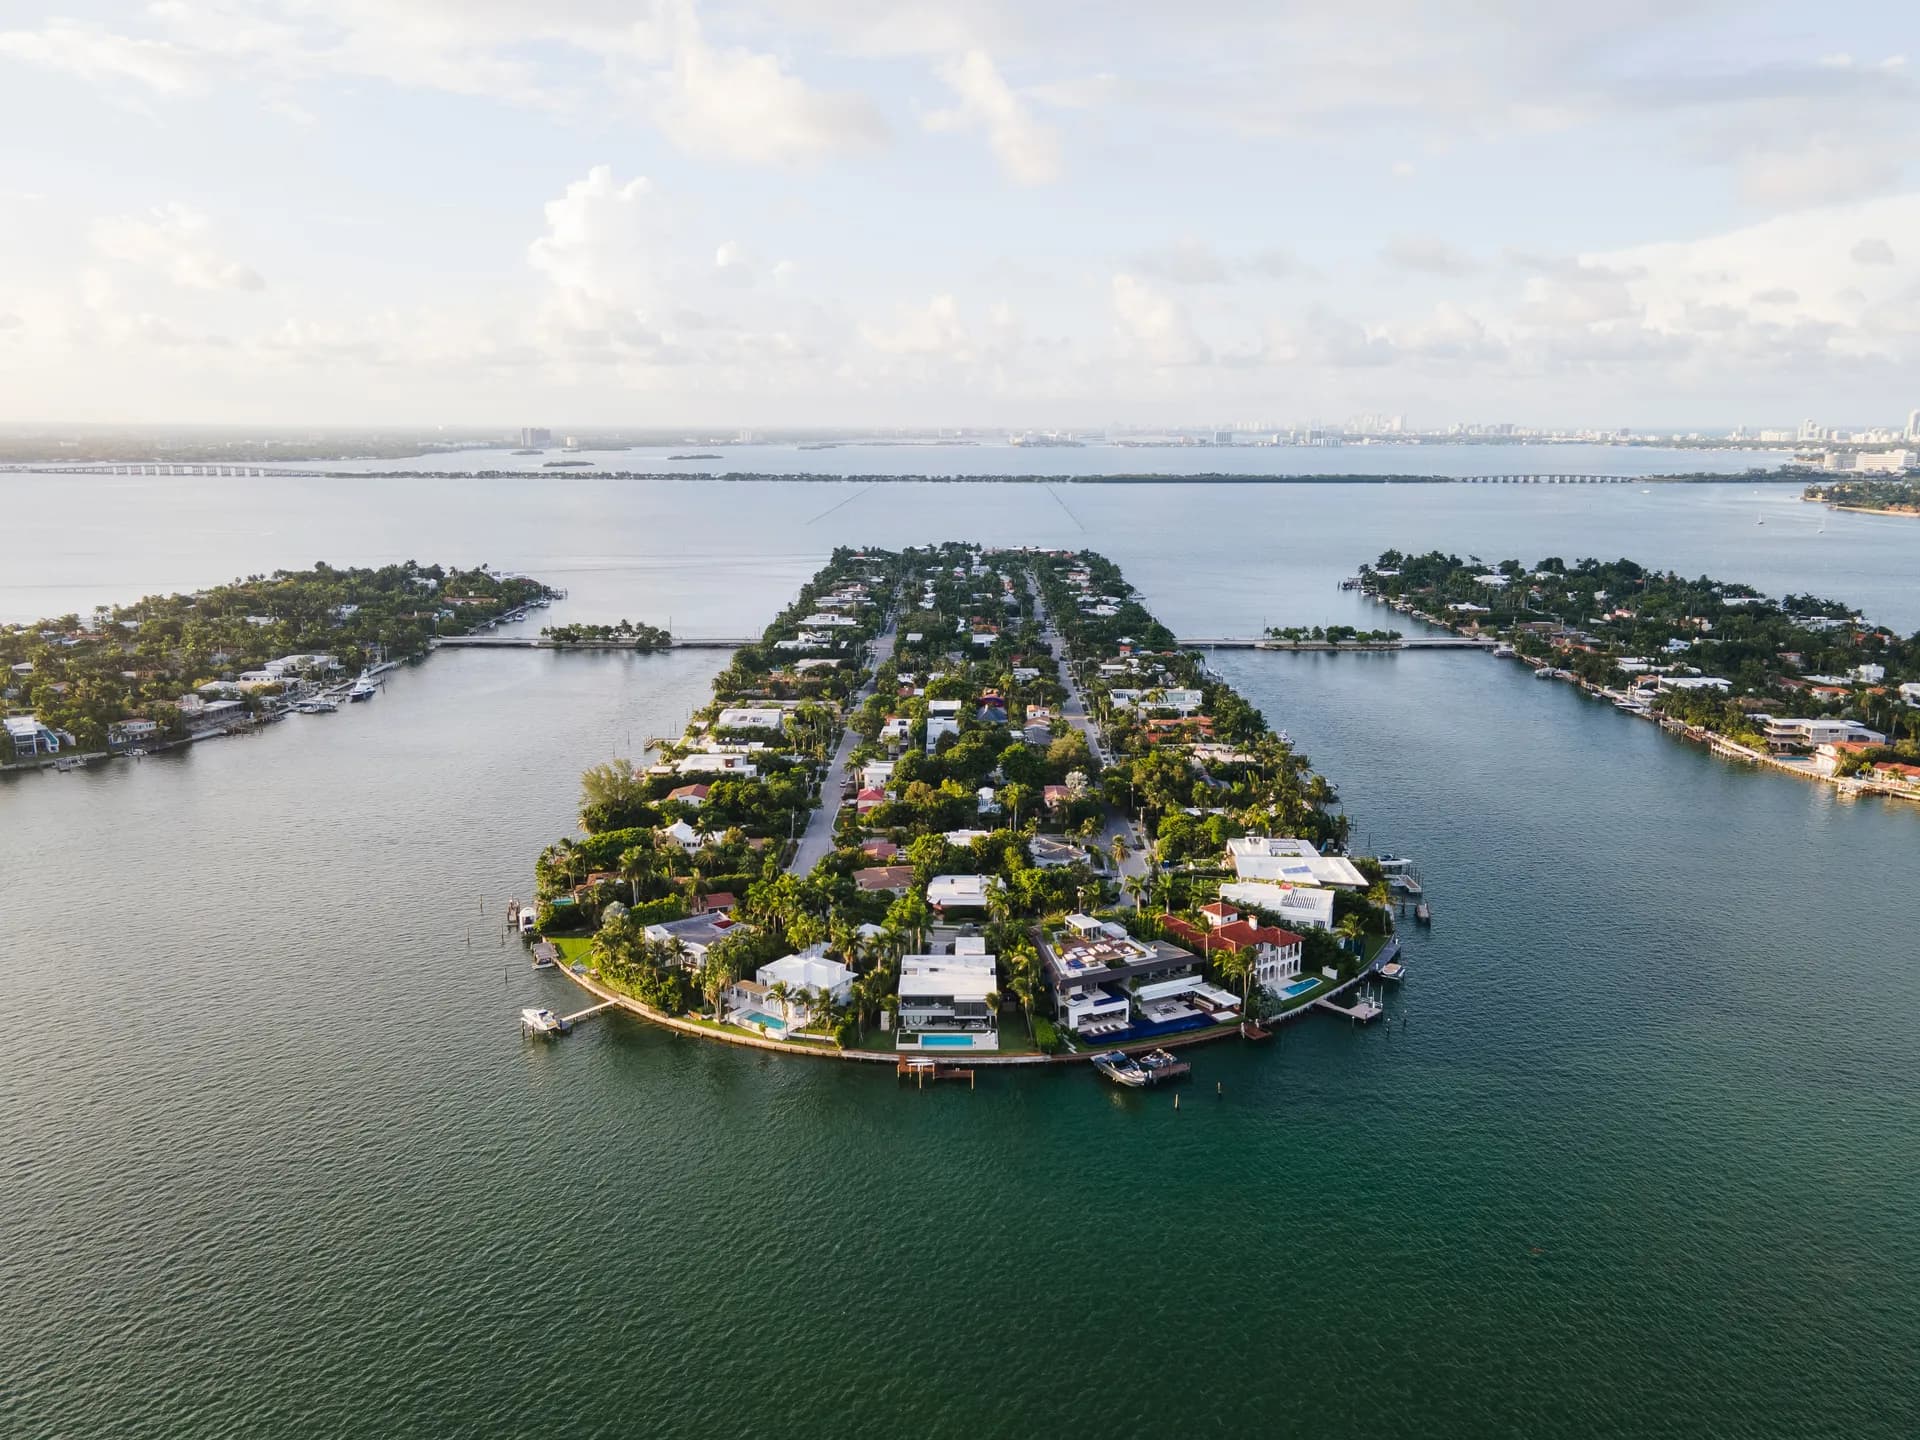
Venetian, Sunset, Palm or Hibiscus? What Your House Budget Buys
$6 million gives you five Venetian houses to compare and none on Sunset. At $20 million, waterfront enters the search. Here is where each island fits your budget.