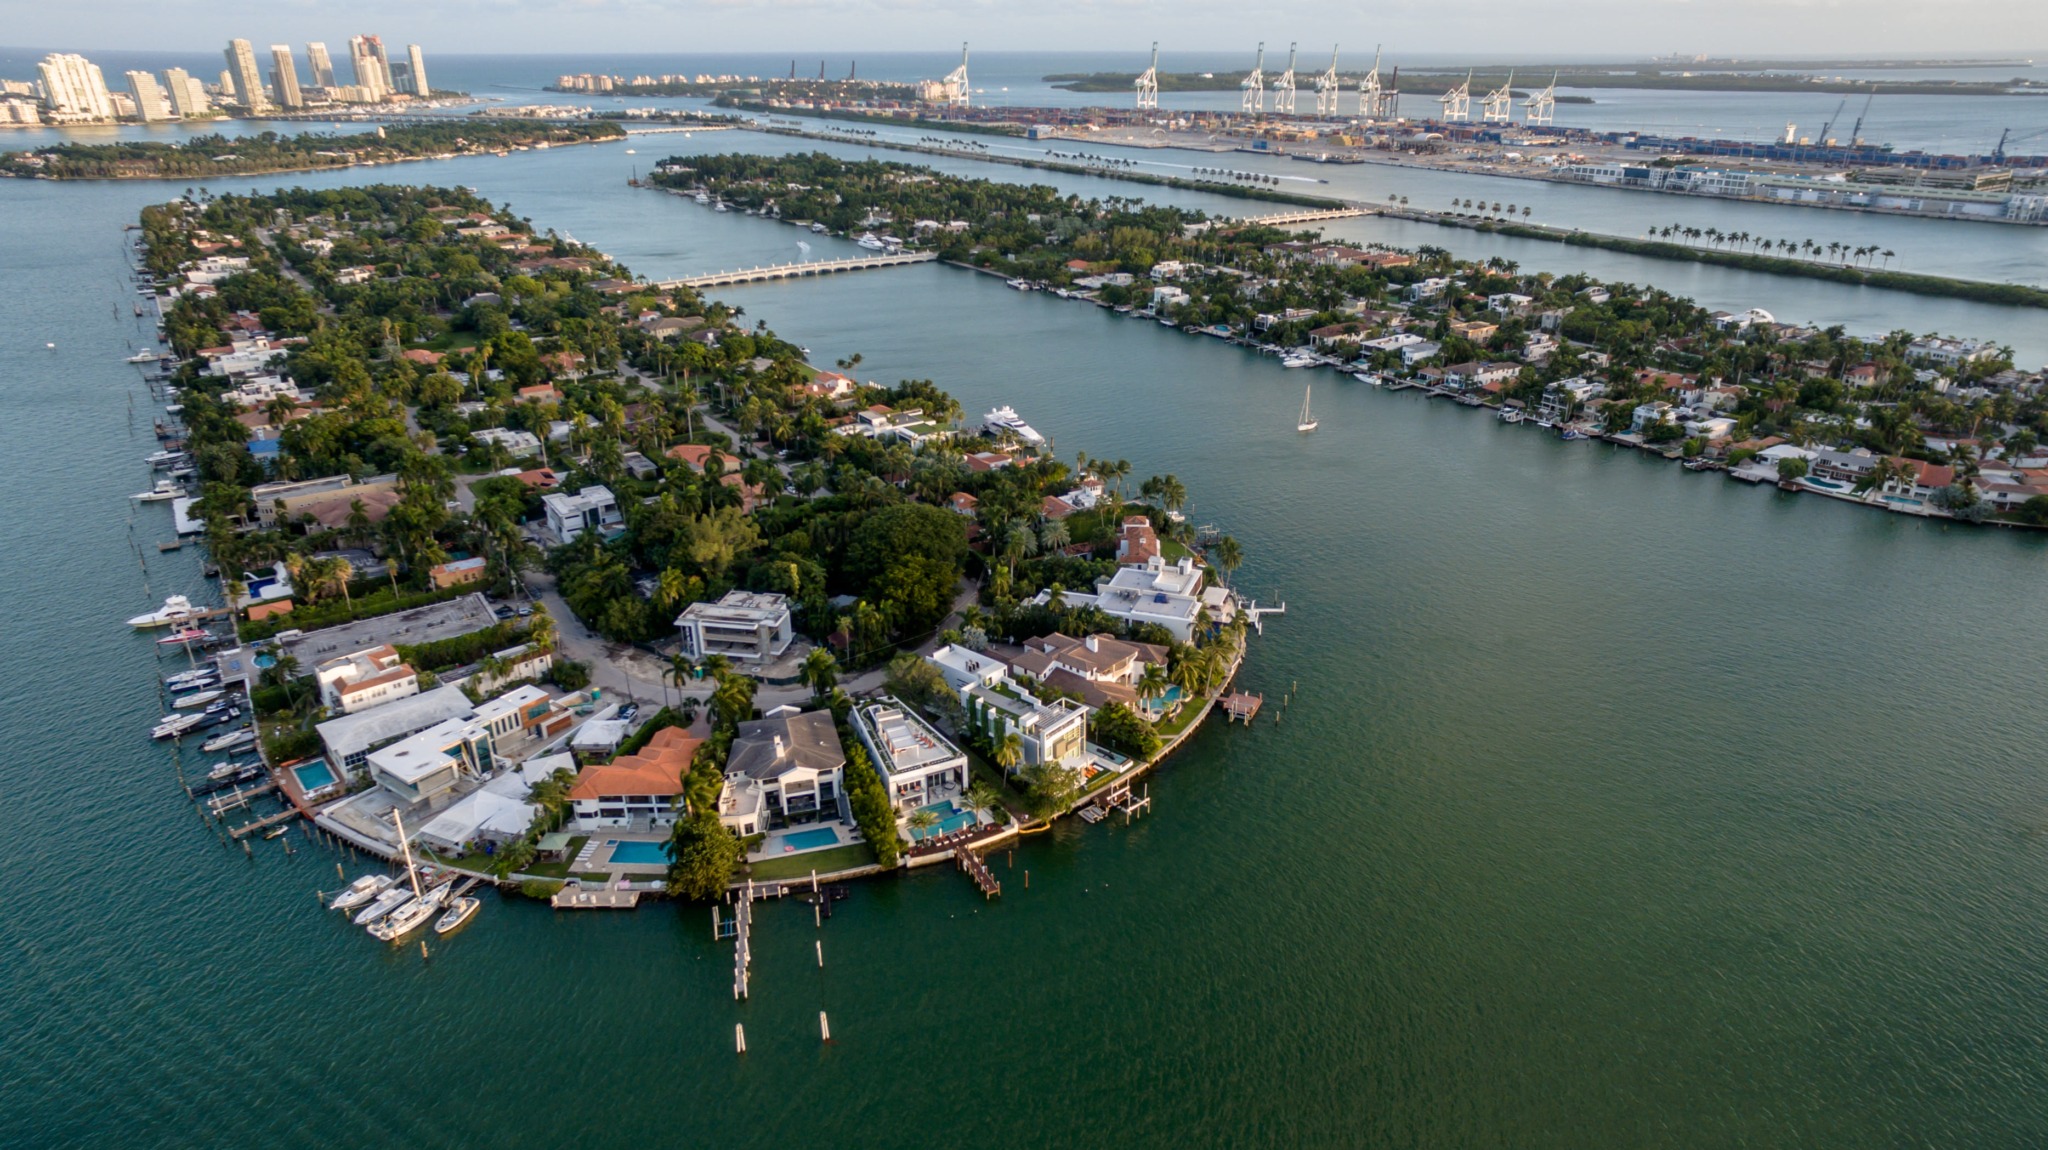
Hibiscus & Palm Islands Market Report - Issue #26 - December 01, 2025
Waterfront softening, non-waterfront edging up, and rentals showing a wide spread. Six sales and slower pace mean buyers have leverage—get the full numbers for Hibiscus and Palm Islands.


Hibiscus & Palm Islands Market Report - Issue #26 - December 01, 2025
Market Cools as Both Sales and Prices Soften
Prepared by REHub Miami - a mother-and-son real estate team with $30M+ in recent Miami sales and a Blackstone investment background, specializing in Hibiscus Island, Palm Island, and Miami Beach.
Big Picture in 30 Seconds
Sales data from December 2024-November 2025 (LTM). Rental data as of 12/1/2025.
- Waterfront softening: Averaging $3,148/SF, down 6.3% year over year.
- Non-waterfront rising: Averaging $1,407/SF, up 1.7% from last year.
- Island comparison: Hibiscus at $2,011/SF; Palm at $2,544/SF with Hibiscus having the fastest sales pace (183 days on market).
- Activity slowdown: 6 total sales, down 50% year over year. Average days on market: 215 days (25% slower than last year).
- Waterfront premium: True waterfront continues to command roughly a 124% premium over non-waterfront.
- Rental overview: 16 active listings, ranging from $15K to $125K/month.
- Median asking: Waterfront $72K, Non-waterfront $20K
- Palm median: $62K
- Hibiscus median: $42K
Current Rental Market
16 single-family homes available · Median monthly rent · As of December 01, 2025
| Location | 3 BR | 4 BR | 5 BR | 6 BR | 7+ BR |
|---|---|---|---|---|---|
| Hibiscus WF | - | - | $68K | $65K | - |
| Hibiscus Non-WF | - | $20K | $30K | - | - |
| Palm WF | $45K | - | $41K | $80K | $110K |
| Palm Non-WF | - | $20K | - | - | - |

Recent Momentum
(June–November 2025 vs December 2024–May 2025)
Sales ↓ 50.0% · $/SF ↓ 1.7% · DOM ↓ 10.4%
Buyers have more leverage - fewer transactions and softer pricing, but serious buyers are closing faster.
Recent Notable Sales on Hibiscus & Palm Islands
Hibiscus Island - Sold for $31.8M
370 S Hibiscus Dr

$2,952 per SF · 10,754 SF · 5 bed · 6 bath · Built 2016 · 183 days on market · Waterfront · Pool
Hibiscus Island - Sold for $9.9M
65 S Hibiscus Dr

$1,530 per SF · 6,491 SF · 7 bed · 8 bath · Built 2020 · 163 days on market · Pool
Palm Island - Sold for $8.9M
316 S Coconut Ln

$3,808 per SF · 2,340 SF · 4 bed · 5 bath · Built 1940 · 207 days on market · Waterfront · Pool
Palm Island - Sold for $7.0M
277 N Coconut Ln

$2,684 per SF · 2,608 SF · 5 bed · 6 bath · Built 1950 · 437 days on market · Waterfront · Pool
Hibiscus Island - Sold for $3.9M
118 E 3rd Ct

$1,549 per SF · 2,517 SF · 4 bed · 4 bath · Built 1941 · 223 days on market
What This Means If You Own Here
Thinking About Selling Your Home?
-
Waterfront sellers: 3 sales · $3,148/SF · about 207 days on market The market has cooled - longer days on market and softer prices. Translation: realistic pricing is critical - consider what today's buyers are actually paying.
-
Non-waterfront sellers: 3 sales · $1,407/SF · about 223 days on market Homes are taking longer to sell - buyers are pickier. Translation: prices are holding, but presentation still matters for top dollar.
Thinking About Renting Your Home?
- Waterfront owners: Current median asking rent is $72K/month with 10 competing listings on the market.
- Non-waterfront owners: Current median asking rent is $20K/month with 6 competing listings on the market.
- With 16 active rentals, the market is competitive - presentation and pricing matter.
Long-Term Owners
Even if you are not planning to move, understanding current values matters for refinancing, insurance, and estate planning. The market has shifted - knowing where you stand is smart.
By the Numbers (Still Simple)
- Total single-family sales: 6
- Total sales volume: ~$65M
- Median sale price: $8.0M
- Average price per square foot (all single-family): $2,277/SF
- Typical time to sell: about 215 days (7.2 months)
- Current active listings: ~20 homes on the islands
You do not need to memorize any of this - it's here so you have real numbers, not just headlines.
About REHub Miami
REHub Miami is a mother-and-son real estate team with $30M+ in recent Miami sales, specializing in Hibiscus Island, Palm Island, and Miami Beach.
- Kyle Benjamin: Former investment professional at Blackstone, bringing a financial and analytical lens to pricing, offer strategy, and negotiations.
- Kimberley Lieberbaum: Decades of experience living and working in Miami, with a deep understanding of the islands and their buyers.
Together, we combine hard data with on-the-ground insight to help you decide if, when, and how to move - or whether staying put is the smartest move.
Curious What Your Home Would Sell For Today?
If you would like a private, property-specific valuation (not just a Zestimate-style guess), reach out any time:
kyle@rehubmiami.com | 305-494-0937
Data is deemed reliable but not guaranteed. Compiled December 01, 2025 from Miami Beach MLS.
Tags
Related Articles

Venetian Islands Market Report - Issue #5 - December 01, 2025
Waterfront prices are up, activity is rising, and the premium for true waterfront on the Venetian Islands now sits near 174%. Dive into the latest sales, pace, and what it means for sellers and buyers.
A Buyer's Guide to Miami Beach's Luxury Islands: Star Island vs. Venetian Islands vs. Palm & Hibiscus
Compare Miami Beach's most exclusive island neighborhoods: Star Island, Venetian Islands, Palm & Hibiscus, Sunset Islands, La Gorce, Allison Island, and Fisher Island. Pricing, lifestyle, and which luxury enclave fits you best.
Miami Market Report — June 2026: Trophy Neighborhoods, Condo & Home Price Trends
A data-driven mid-2026 look at Miami's trophy neighborhoods — median price per square foot, year-over-year trends, and buyer-vs-seller conditions across Fisher Island, South of Fifth, Brickell, Coconut Grove, Key Biscayne and more.