Continuum North vs Continuum South: The 2026 Market Report
Real MLS data across both Continuum towers -- median close per foot, active list per foot, sale-to-list, days on market, and the recent-comp roster -- benchmarked against the South of Fifth neighborhood and the Miami-Dade condo metro.

Continuum North vs Continuum South: The 2026 Market Report
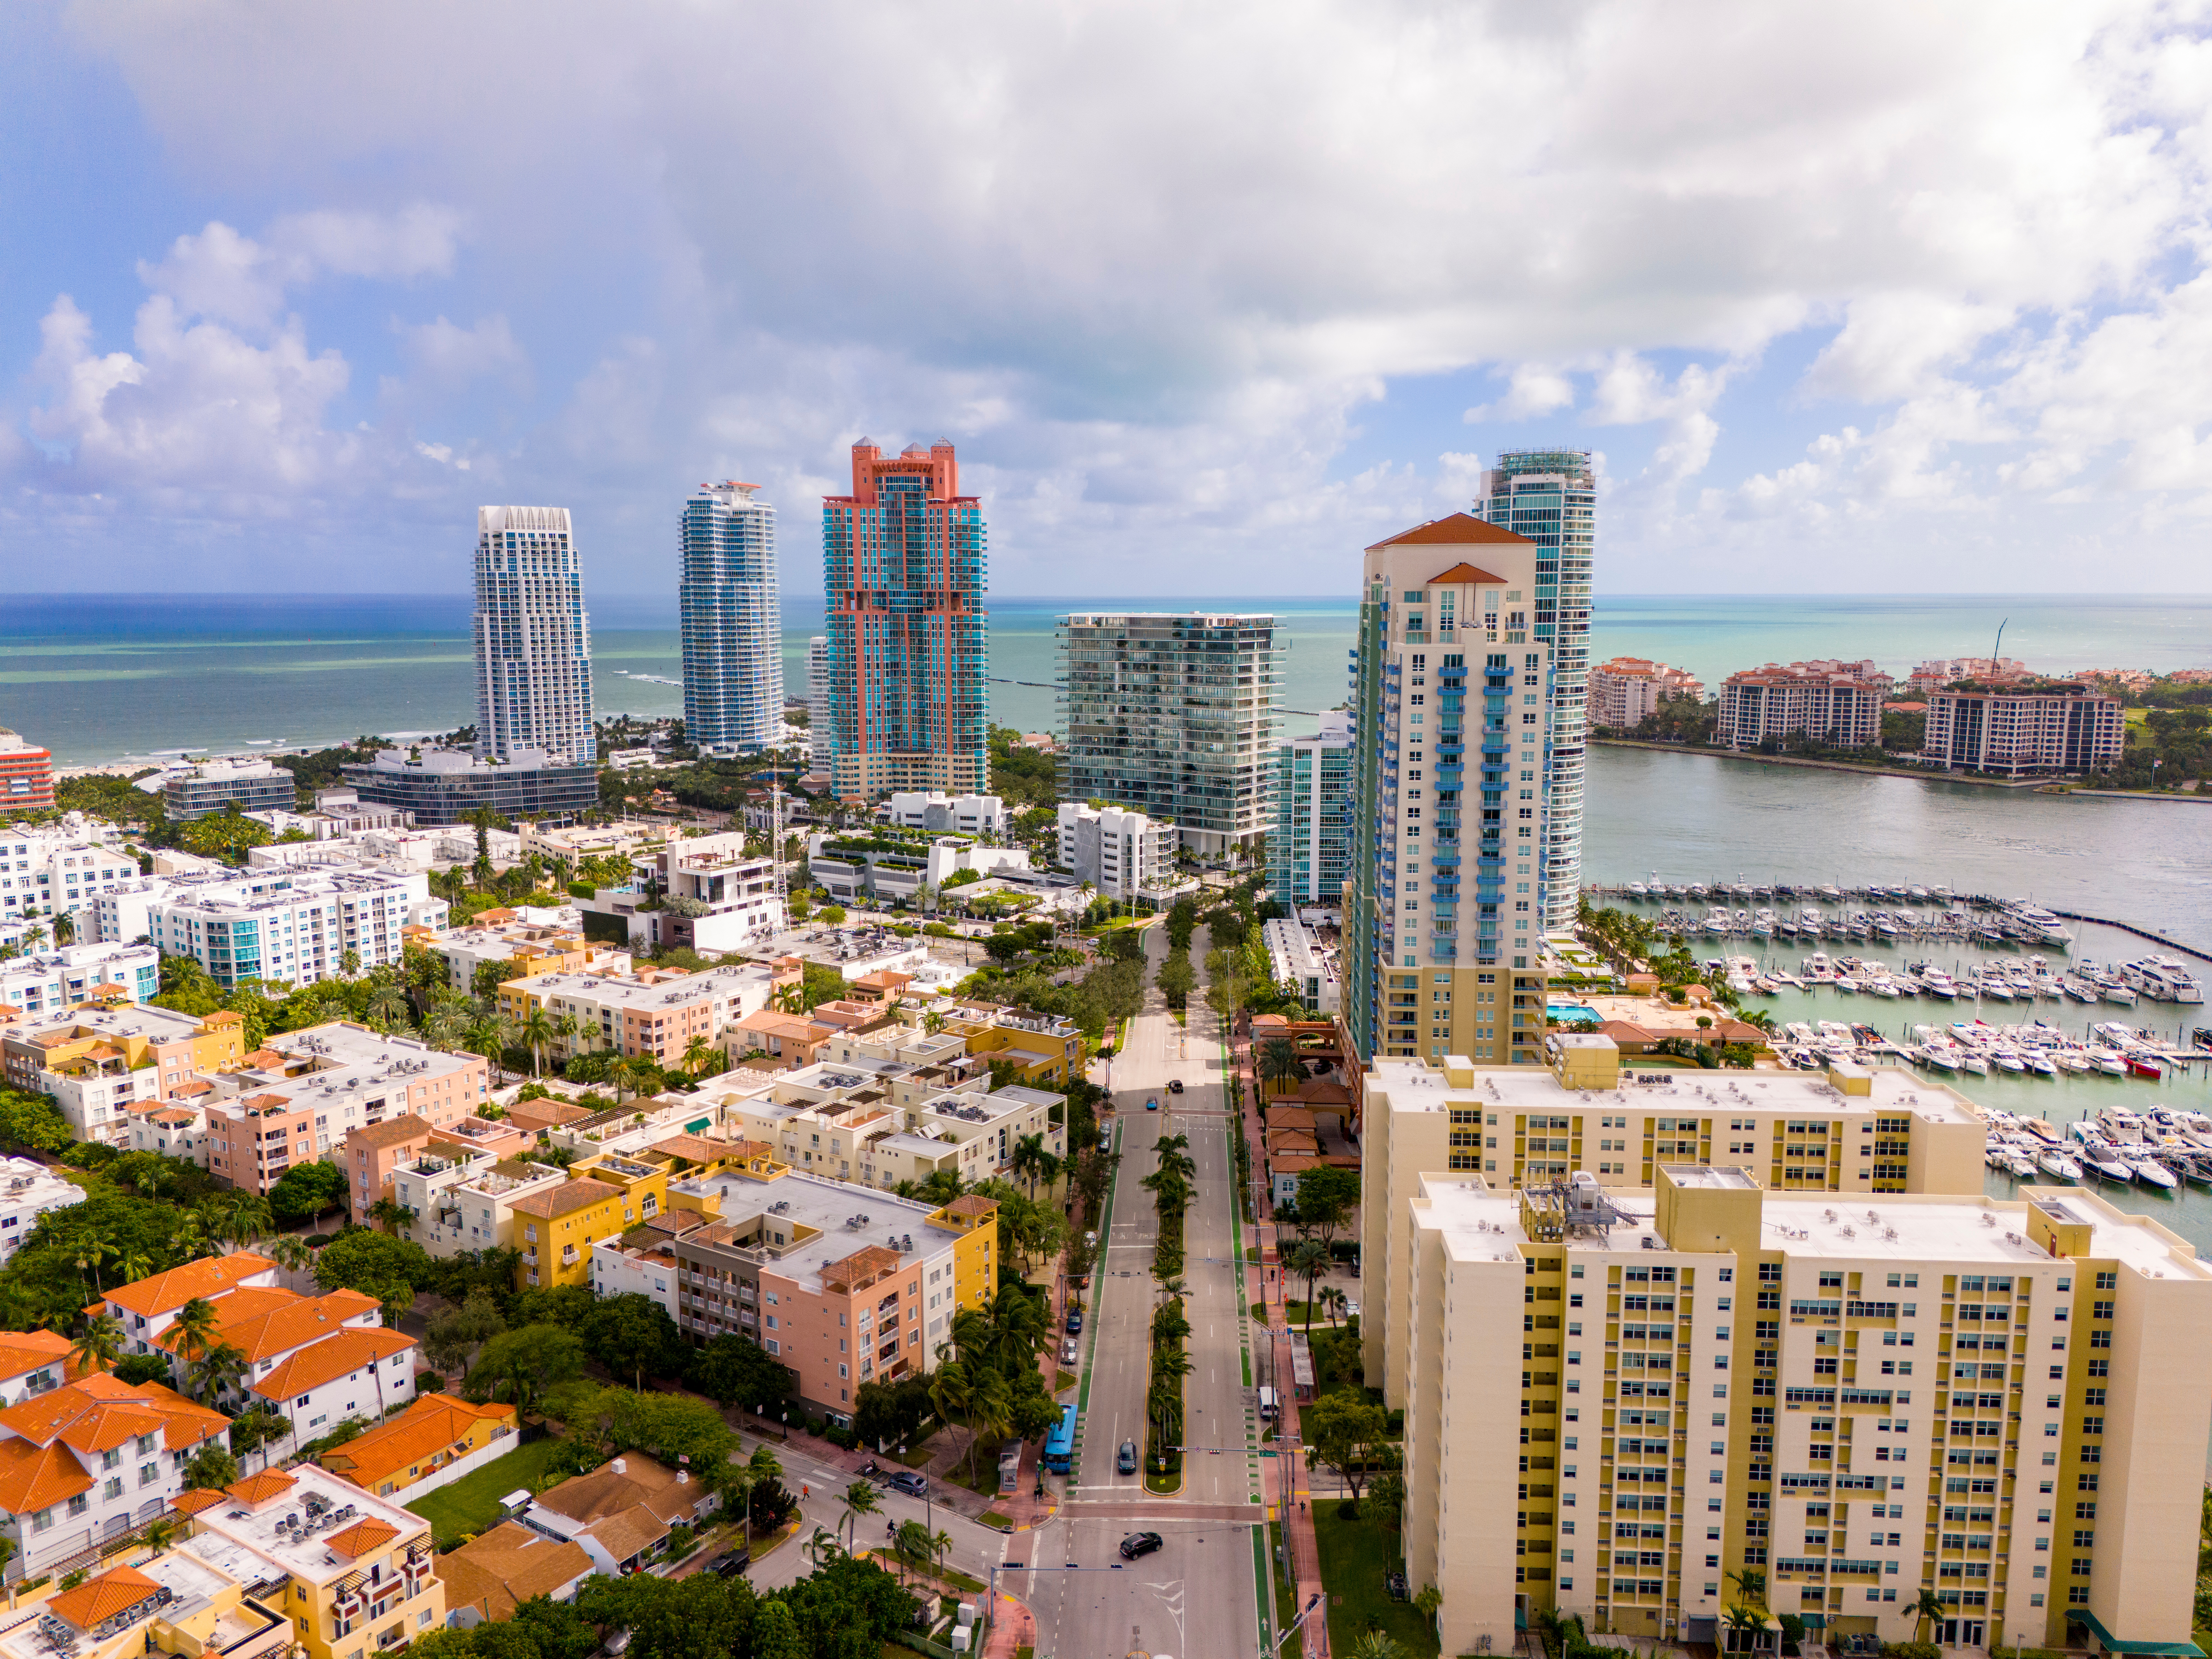
The Continuum on South Beach is the 12-acre, 1,000-foot-of-oceanfront campus at the southernmost tip of Miami Beach, developed by Ian Bruce Eichner across two towers: Continuum South at 100 South Pointe Drive (42 stories, 318 residences, delivered 2002) and Continuum North at 50 South Pointe Drive (37 stories, 203 residences, delivered 2008). Same campus, same amenity deck, same private beach -- meaningfully different pricing behavior.
This report pulls the current market data on both towers straight from our MLS pipeline and benchmarks each against the South of Fifth neighborhood and the Miami-Dade condo metro. If you're deciding between the two towers, or between the Continuum and the rest of SoFi, this is the read.
For the building-level walkthrough (floor plans, amenities, tower differences), see the companion piece: Continuum North vs Continuum South Buyer's Guide.
The Headline Numbers
Data as of the latest snapshot in our pipeline. Median close price-per-foot uses the trailing 12-month window; active list PSF is the current active-listing median; sample sizes shown so you can weigh the confidence.
| Metric | Continuum North | Continuum South | South of Fifth | Miami-Dade Condos |
|---|---|---|---|---|
| Active listings for sale | 5 | 14 | 36 | 12,465 |
| Median active list PSF | $3,058 | $4,116 | $2,764 | $422 |
| Median active list price | $6.66M | $9.27M | $6.30M | $420K |
| Median close PSF (trailing 12mo) | $3,263 | $2,753 | $1,331 | $404 |
| Median sale-to-list ratio | 84.3% | 93.5% | 93.7% | 95.0% |
| Median days on market (active) | 188 | 196 | 217 | 142 |
| Closes trailing 24 months (our pipeline) | 7 | 21 | -- | -- |
The counterintuitive finding: Continuum South is currently listed at a higher PSF than Continuum North ($4,116 vs $3,058), but Continuum North is closing at a higher PSF than Continuum South over the trailing twelve months ($3,263 vs $2,753). South's list-side ambition and North's close-side execution have inverted the surface signal.
Two forces pull in opposite directions:
- South is the older, larger tower (2002, 318 units). More turnover, more distressed sales in the mid-tier means the closing distribution has a longer left tail.
- North is the newer, boutique-scale tower (2008, 203 units). Fewer listings, fewer distressed exits, closes cluster tighter and higher. The 12-month closing PSF band on North sits above South's despite the smaller sample.
Recent Closes
Everything below is closed MLS data from our pipeline, sorted newest first.
Continuum North Closes (trailing 24 months)
| Date | Unit | Close price | List price | Sale-to-list |
|---|---|---|---|---|
| 2026-06 | TWN7 (townhome) | $9,000,000 | $9,375,000 | 96.0% |
| 2026-04 | 2703 | $8,425,000 | $9,995,000 | 84.3% |
| 2026-01 | 606 | $1,735,000 | $1,735,000 | 100.0% |
| 2025-07 | 1601 | $12,750,000 | $13,650,000 | 93.4% |
| 2025-04 | 2402 | $10,000,000 | $10,500,000 | 95.2% |
| 2025-03 | 1207 | $3,500,000 | $3,800,000 | 92.1% |
| 2024-11 | 604 | $1,800,000 | $2,099,500 | 85.7% |
North's trailing-24-month sample is small (seven closes), but every close over $8M has cleared -- and the 1601 top-floor unit cleared at $12.75M. The two smaller closes at 604 and 606 anchor the low end of the pool floor stack.
Continuum South Closes (trailing 24 months, top 10)
| Date | Unit | Close price | List price | Sale-to-list |
|---|---|---|---|---|
| 2026-04 | 2506 | $5,000,000 | $5,350,000 | 93.5% |
| 2026-04 | 903 | $3,650,000 | $3,650,000 | 100.0% |
| 2026-03 | 3402 | $5,500,000 | $5,970,000 | 92.1% |
| 2026-02 | 3803 | $19,900,000 | $24,250,000 | 82.1% |
| 2026-01 | 909 | $4,450,000 | $4,900,000 | 90.8% |
| 2026-01 | TH-13 (townhome) | $3,746,000 | $4,900,000 | 76.4% |
| 2025-12 | 3601 | $6,000,000 | $6,350,000 | 94.5% |
| 2025-11 | 2608/2609 (combined) | $18,800,000 | $19,390,000 | 96.9% |
| 2025-10 | 3605 | $6,700,000 | $7,200,000 | 93.1% |
| 2025-08 | 3003 | $14,765,000 | $15,900,000 | 92.9% |
South has cleared three closes above $14M in the trailing 12 months (3803, 2608/2609, 3003) -- the trophy-floor stack is moving. The 3803 close at $19.9M against a $24.25M ask (82.1% sale-to-list) is the biggest single-unit price cut on the campus over the reporting period.
Current Active Inventory
Continuum North (5 active)
| Unit | Ask | SF | Ask PSF | Status |
|---|---|---|---|---|
| 1201/08 (combined) | $16,900,000 | 3,497 | $4,833 | Active |
| 707 | $3,950,000 | 1,440 | $2,743 | Active |
| 1005 | $3,850,000 | 1,698 | $2,267 | Active Under Contract |
| 705 | $3,700,000 | 1,897 | $1,950 | Active |
| 504 | $1,750,000 | 699 | $2,504 | Active |
The North inventory is barbell-shaped: one $16.9M trophy line-08 assemblage on the 12th floor, three mid-tower units in the $3.7-$3.95M band, and a single sub-$2M studio-scale unit on the pool floor. The combined 1201/08 at $4,833 PSF is the current top of North's active market and roughly matches the top of South's line-06/07 assemblages.
Continuum South (14 active, top 10 by price)
| Unit | Ask | SF | Ask PSF | Status |
|---|---|---|---|---|
| 1906/07 (combined) | $22,000,000 | 4,378 | $5,025 | Pending |
| 1106/07 (combined) | $20,950,000 | 4,378 | $4,785 | Active |
| 3203 | $17,900,000 | 3,335 | $5,367 | Active |
| 1409/10 (combined) | $16,350,000 | 3,717 | $4,399 | Active |
| 1206 | $13,675,000 | 2,508 | $5,453 | Active |
| 606 | $9,995,000 | 2,508 | $3,985 | Active |
| 510 | $8,547,150 | 2,122 | $4,028 | Active |
| 908 | $7,995,000 | 1,757 | $4,550 | Active |
| 506 | $7,995,000 | 2,508 | $3,188 | Active |
| 2208 | $6,350,000 | 1,595 | $3,981 | Active |
South's active inventory is deeper and more expensive at the top. Line-06/07 assemblages at 1906/07 and 1106/07 are asking $22M and $20.95M respectively. Line-06 non-combined units on the mid-floors are asking $5,000-$5,500 PSF. There is one line-06/07 assemblage currently pending -- meaningful for the closing pipeline over the next 90-120 days.
What The Trend Actually Says
Read the numbers side-by-side and three signals emerge.
1. South's list-PSF gap over North (34% higher) is a supply-mix effect, not a value gap. South's active pool is dominated by trophy line-06/07 assemblages and 3000-4000 SF combined units. North's active pool is dominated by mid-tower 1400-1900 SF single-line residences. Compare apples-to-apples across similar-size lines and the two towers price much closer -- and North's newer construction (2008 vs 2002) and lower unit density (203 vs 318) actually get some premium back.
2. The Continuum campus is ~2.4x the SoFi neighborhood on close PSF. Trailing 12-month median close PSF: North $3,263, South $2,753 -- against South of Fifth's $1,331. Even the older tower is closing at more than double the neighborhood median. That premium is what a buyer is paying for on the 12-acre oceanfront campus -- everything else in the neighborhood is either non-oceanfront (Portofino, Murano, Icon, Yacht Club at Portofino) or smaller-boutique (Ocean House, Louver House, Glass, Marea).
3. The Continuum trade over Miami-Dade is 7-8x on close PSF. Median metro close PSF is $404. North trades at 8.1x; South at 6.8x. This is the Continuum's positional rent -- 1,000 feet of private oceanfront, S. Pointe Park adjacency, and the barrier-to-entry at the SoFi south tip.

Sale-to-List and Days on Market
Continuum North closed the last twelve months with a lower median sale-to-list (84.3%) than Continuum South (93.5%). Two things drive that:
- North's sample is small (seven closes) and one weak trade (Unit 2703 at 84.3% of list) skews the median disproportionately.
- North sellers are pricing to the newer-construction premium first and negotiating down; South sellers are meeting the market closer to the ask on smaller-line inventory.
Days on market are effectively the same across both towers (North 188, South 196). Both trade slower than the Miami-Dade metro (142 days) -- the trophy tier just moves at a different clock.
How This Compares to South of Fifth Broadly
South of Fifth's median close PSF (trailing 12-month median in our pipeline) sits at roughly $1,331. The Continuum campus trades at approximately 2x-2.5x that number.
The other SoFi trophy pool -- Apogee, Portofino Tower, Murano Grande, Ocean House, Louver House -- clusters between the neighborhood median and the Continuum trade. For a broader neighborhood view of these buildings and how they price against one another, see South of Fifth Condos Compared.
How This Compares to Miami-Dade
Miami-Dade condo metro at $404 close PSF versus Continuum North at $3,263 close PSF. The Continuum trades at roughly 8x the metro number. That gap is the direct oceanfront + campus + Ian-Bruce-Eichner-era-execution premium. It is one of the tightest oceanfront concentrations of premium PSF in the county.
Which Building Suits Which Buyer
Buyer 1: Trophy line-06 or line-07 assemblage. Continuum South. South is the only campus with active combined 06/07 layouts at the 4,378 SF scale in the $20M+ band. Recent closes at 1906/07 and 2608/2609 confirm this is a live market with genuine transaction depth.
Buyer 2: Newer building, smaller resident community, boutique feel. Continuum North. Six years newer construction, 115 fewer units, higher per-foot close average, and a slightly firmer floor stack on line 04-05.
Buyer 3: Mid-tower single-line unit in the $3-5M band. Either tower -- both have inventory in this band. North's 705, 707, and 1005 are direct-comparable to South's 909, 903, TH-13. Choice comes down to floor level, exposure, and renovation status per unit.
Buyer 4: Beach-facing pool-floor line. Both towers have pool-floor inventory. North's 504 at $1.75M and South's mid-tier line-03s are the entry points -- expect $1.75-3.75M and $2,000-$3,500 PSF depending on view line, floor, and renovation.
FAQ
What is the median close PSF at Continuum North? Trailing 12-month median close price-per-foot is $3,263 across seven closes in our pipeline. The distribution is barbell-shaped: two closes under $2M on the pool floor and five closes between $3.5M and $12.75M in the tower.
What is the median close PSF at Continuum South? Trailing 12-month median close price-per-foot is $2,753 across 21 closes. The sample is larger and more distributed than North's -- South has cleared three closes above $14M in the last year, and the top trade was Unit 3803 at $19.9M.
Why is Continuum South listed at a higher PSF than Continuum North? The mix. South's active pool includes several line-06 and line-07 combined assemblages priced at $4,400-$5,450 PSF, which pulls the median up. North's active pool is weighted toward smaller mid-tower units at $2,000-$3,000 PSF. Comparing similar unit sizes across the two towers, the PSF differential is much smaller.
How does the Continuum trade versus the rest of South of Fifth? Approximately 2x-2.5x. South of Fifth's median close PSF sits near $1,331, while both Continuum towers close in the $2,750-$3,263 band. That premium is for the 12-acre campus, 1,000 feet of oceanfront, and the direct South Pointe Park adjacency at the barrier-island tip.
How does the Continuum trade versus Miami-Dade broadly? Roughly 7-8x on close PSF. Metro median condo close PSF is $404; Continuum trades at $2,753-$3,263.
How long do units take to sell? Median days on market on active listings: 188 at North, 196 at South. That's slower than the Miami-Dade metro (142 days) but consistent with the trophy tier. Days on market matter less than pricing calibration -- the fastest closes at both towers were the ones priced to comps from delivery rather than aspirationally.
What's the biggest sale-to-list gap you're seeing? The 2026-02 close of Continuum South Unit 3803 at $19.9M against a $24.25M ask (82.1% sale-to-list). That's a $4.35M concession on a single trade -- the widest of any recent close on the campus.
Is now a good time to sell my Continuum unit? It depends on unit line. South line-06/07 assemblages are clearing at 93-97% of list with genuine buyer depth (one currently pending). North line-01 through line-04 mid-tier is thinner -- fewer transactions, longer market times, larger concessions. Ask us for a unit-level comp analysis before you list.
Data Methodology
All figures pulled from the CondoBlackBook / REHUB market pipeline as of the most recent daily snapshot. Median list PSF is computed on active listings currently on-market; median close PSF and sale-to-list ratio are computed over a trailing 90-day window at the building level and a trailing 12-month rollup at the neighborhood and metro levels. Trailing-24-month closes are shown for context and are pulled from sale_history, the append-only close-side ledger. Sample sizes are shown alongside every median so you can weigh confidence -- Continuum North's seven closes over 24 months is a thin sample by any standard, and the reader should read the trend rather than treat any single figure as canonical.
For a unit-level comp analysis on any specific Continuum North or Continuum South line, contact us and we'll pull the closed comps, the current asks in-line, and the sale-to-list distribution against a specific floor plan.
Related Reading
- Continuum North vs Continuum South: Buyer's Guide -- the building-level comparison
- South of Fifth Condos Compared -- the broader SoFi trophy pool
- Fisher Island Buildings Compared -- adjacent trophy market
This market report is for informational purposes and does not constitute a solicitation or offer to buy or sell real estate. Figures reflect the current state of the CondoBlackBook / REHUB MLS pipeline and are subject to change on subsequent daily snapshots. Prospective buyers and sellers should verify current listings, closed comps, and building financials directly with the listing agent, the building association, and their real-estate attorney before making any purchase or sale decisions.
Condo buildings in South of Fifth
Photos, floor plans, amenities, and current units for sale and rent in each.
- 321 Ocean
- Apogee South Beach
- Continuum North
- Continuum South
- Glass
- Hilton Bentley
- ICON South Beach
- Louver House
- Marea
- Murano at Portofino
- Murano Grande
- Ocean House
- Ocean Park South Beach
- One Ocean
- Portofino Tower
- South Pointe Towers
- The Cosmopolitan
- Three Hundred Collins
- Yacht Club at Portofino
Tags
Related Articles
South of Fifth Miami Beach Condos Compared: SoFi Trophy Guide (2026)
Every trophy condo in South of Fifth compared side by side -- the Portofino/Murano campus, the Continuum twin towers, Apogee, the Rene Gonzalez boutiques, and the Ocean Drive stock. Architects, unit counts, buyer fit.
Continuum North vs Continuum South: Which Tower Should You Buy in 2026?
A side-by-side comparison of Continuum North Tower (50 South Pointe) and Continuum South Tower (100 South Pointe) — year built, unit mix, pricing, lines, and which one actually makes sense depending on your goals.

Hibiscus & Palm Islands Market Report - Issue #26 - December 01, 2025
Waterfront softening, non-waterfront edging up, and rentals showing a wide spread. Six sales and slower pace mean buyers have leverage—get the full numbers for Hibiscus and Palm Islands.