Which Miami Condo Buildings Lost Value Since 2022 (And Which Gained the Most)
We compared closed sale prices per square foot in 2022 against 2025-26 closings across 72,403 recorded sales. Twelve buildings with deep transaction histories are down, twenty-seven are up, and the dividing line is not the neighborhood.

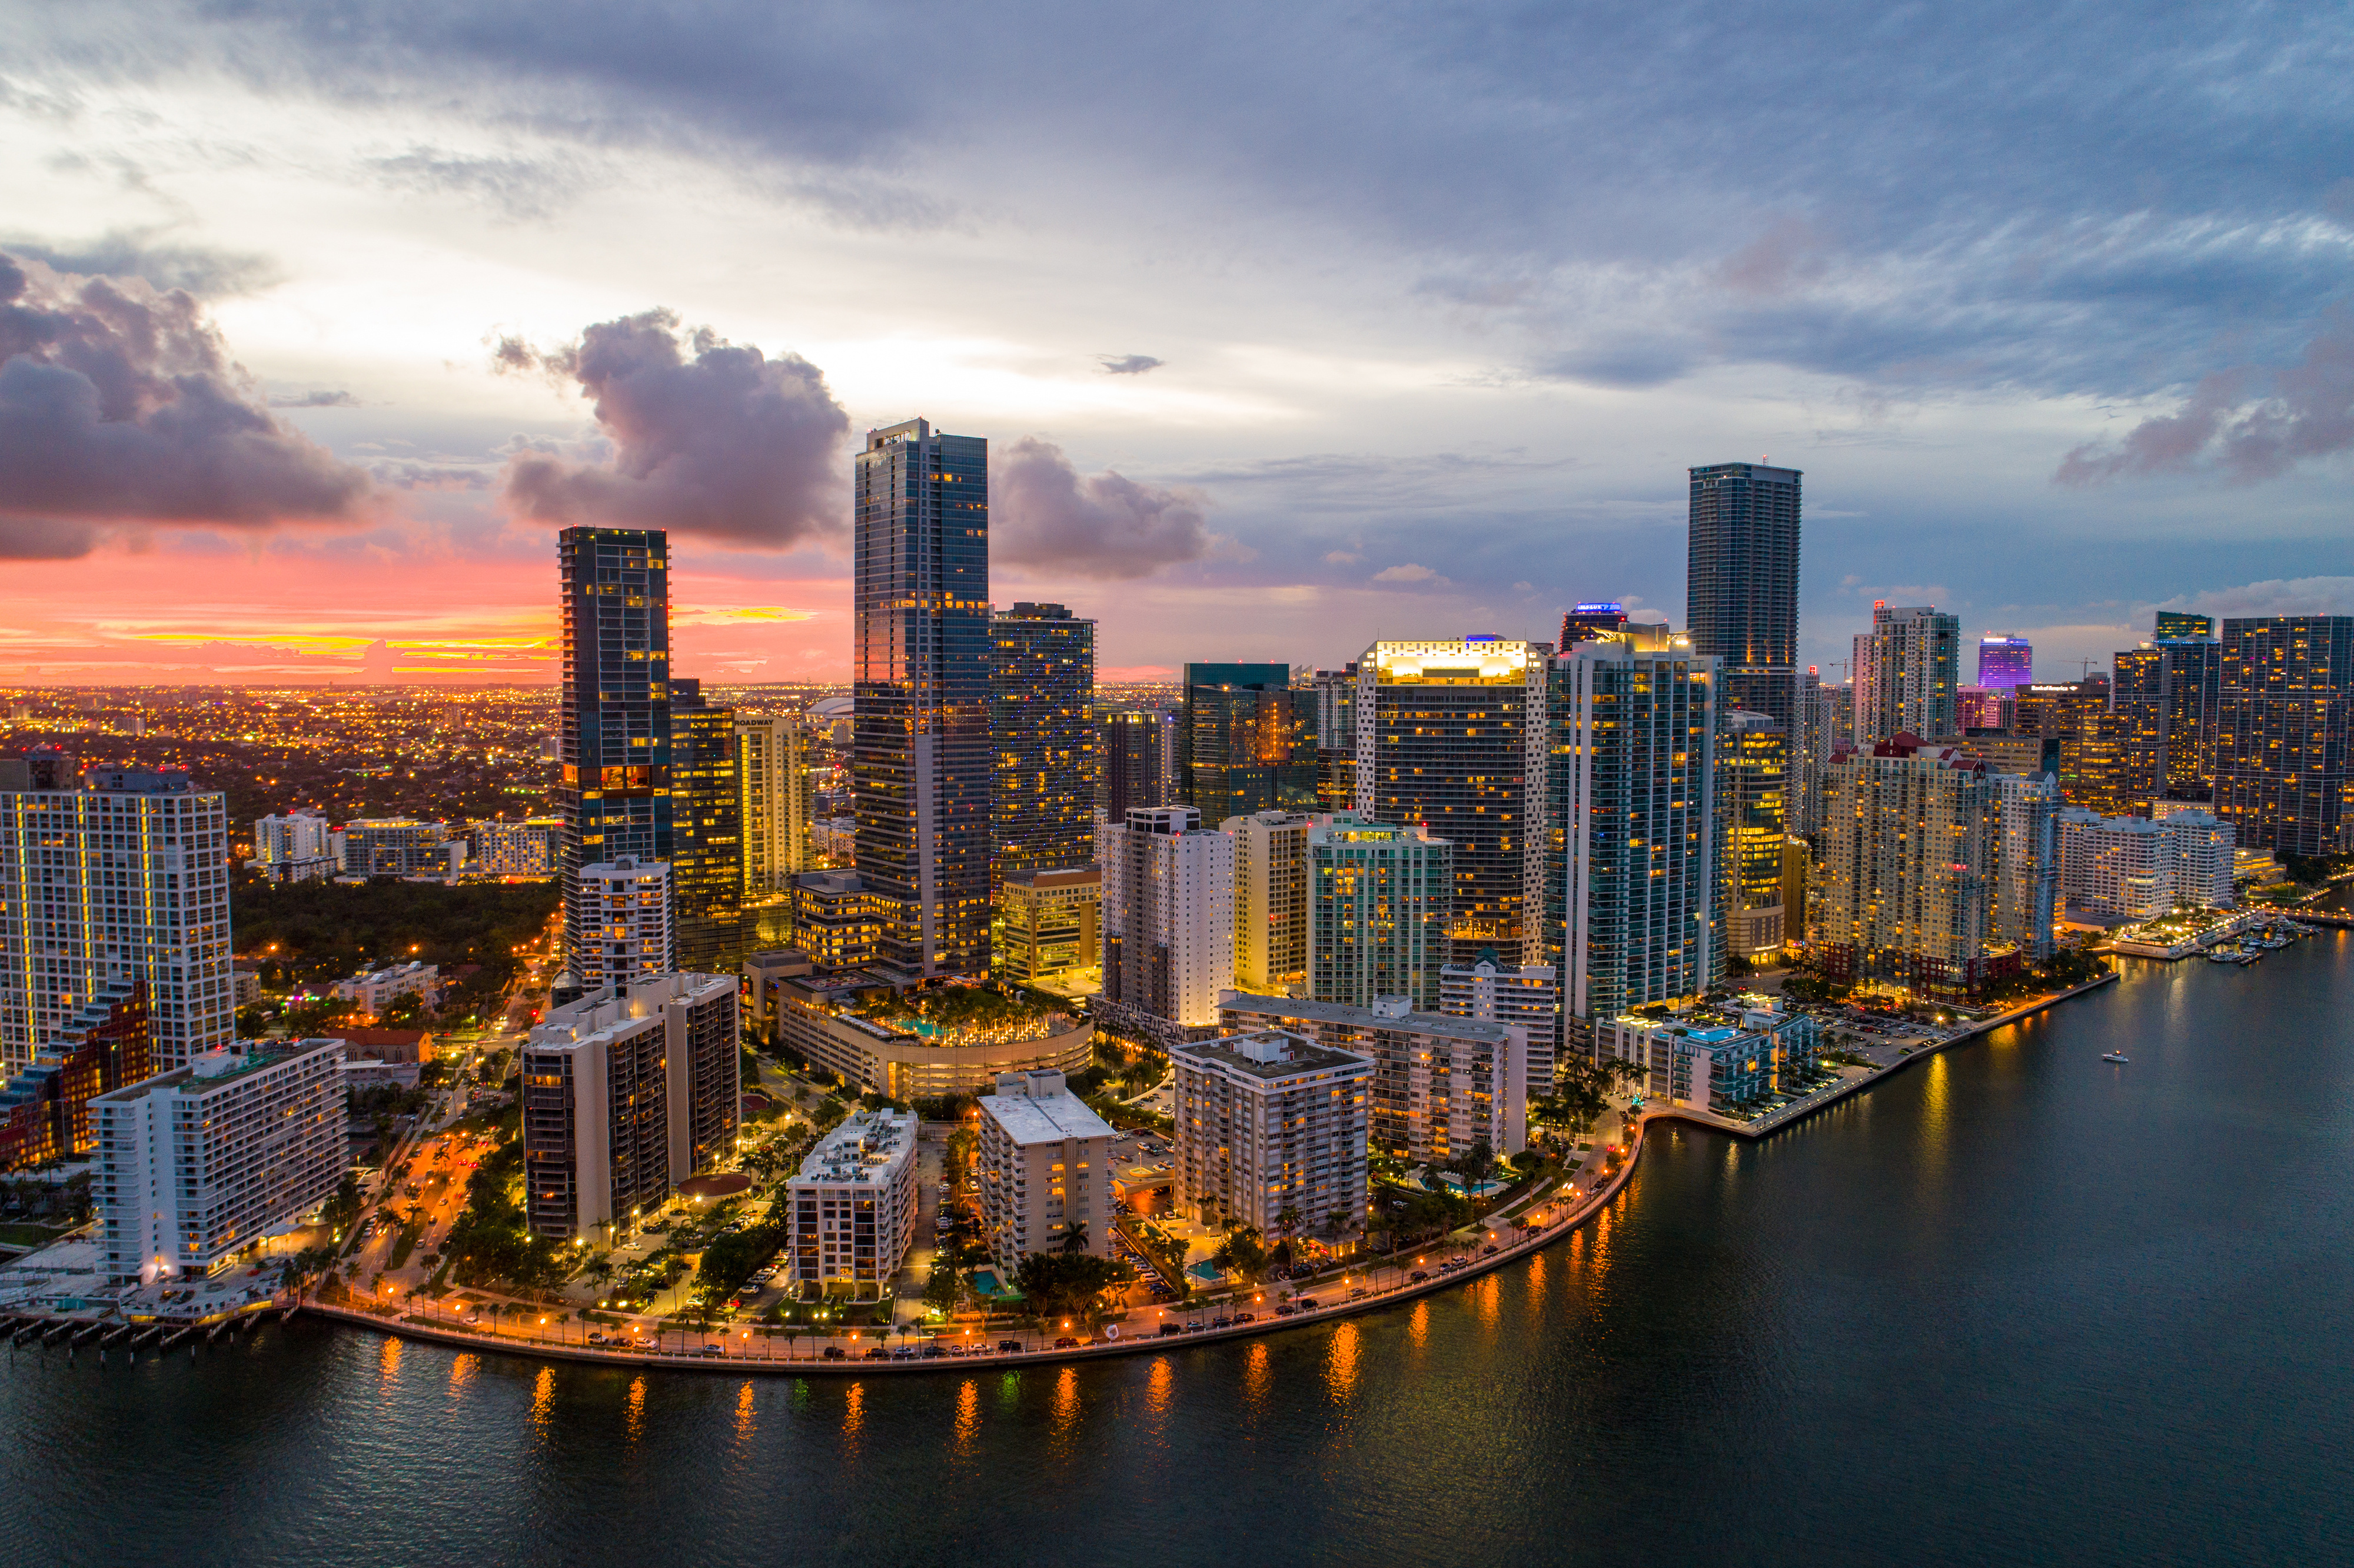
Which Miami Condo Buildings Lost Value Since 2022 (And Which Gained the Most)
"Is the Miami condo market up or down?" is the wrong question, and the data makes that unusually clear.
We pulled 72,403 recorded sales and compared the median closed price per square foot in 2022 against 2025 and 2026 closings, building by building. To keep the comparison honest we only kept buildings with at least 20 closed sales in each window — enough transactions that the median reflects the building rather than which three units happened to trade.
Thirty-nine buildings clear that bar. Twelve are down. Twenty-seven are up. And the split runs straight through the middle of individual neighborhoods, which is the actual finding.
The Buildings That Are Down
| Building | Neighborhood | 2022 | 2025-26 | Change |
|---|---|---|---|---|
| Hamptons West | Aventura | $401 | $321 | -20.1% |
| The Club at Brickell Bay | Brickell | $661 | $570 | -13.8% |
| Opera Tower | Edgewater | $491 | $436 | -11.2% |
| Isola | Brickell Key | $526 | $476 | -9.5% |
| Gran Paraiso | Edgewater | $860 | $780 | -9.3% |
| Paramount Miami Worldcenter | Downtown Miami | $674 | $614 | -8.9% |
| Icon Brickell II | Brickell | $713 | $660 | -7.5% |
| Turnberry Isle | Aventura | $366 | $340 | -7.1% |
| Hyde Resort and Residences | Hollywood Beach | $721 | $687 | -4.7% |
| Brickell Key Two | Brickell Key | $529 | $517 | -2.3% |
| Nine at Mary Brickell Village | Brickell | $558 | $550 | -1.4% |
| Icon Bay | Edgewater | $645 | $644 | -0.2% |
The Buildings That Are Up
| Building | Neighborhood | 2022 | 2025-26 | Change |
|---|---|---|---|---|
| Balmoral | Bal Harbour | $725 | $1,009 | +39.1% |
| Carbonell | Brickell Key | $661 | $864 | +30.7% |
| Carillon Miami Beach | North Beach | $876 | $1,107 | +26.4% |
| 1010 Brickell | Brickell | $720 | $871 | +20.9% |
| 2000 Williams Island | Aventura | $361 | $434 | +20.1% |
| Yacht Club at Portofino | South of Fifth | $912 | $1,047 | +14.8% |
| Harbour House | Bal Harbour | $801 | $894 | +11.6% |
| One Paraiso | Edgewater | $888 | $981 | +10.5% |
| Skyline on Brickell | Brickell | $568 | $624 | +9.9% |
| Quantum on the Bay | Edgewater | $471 | $517 | +9.7% |
| 900 Biscayne Bay | Downtown Miami | $647 | $709 | +9.6% |
| Epic | Downtown Miami | $684 | $747 | +9.2% |
| Merrick Manor | Coral Gables | $760 | $813 | +7.0% |
| Aria on the Bay | Edgewater | $644 | $689 | +6.9% |
| 5252 Paseo | Doral | $475 | $507 | +6.7% |
| Trump Royale | Sunny Isles Beach | $837 | $891 | +6.5% |
| Paraiso Bay | Edgewater | $791 | $838 | +6.0% |
| Paramount on the Bay | Edgewater | $819 | $866 | +5.7% |
| The Bond on Brickell | Brickell | $688 | $726 | +5.5% |
| Parque Towers | Sunny Isles Beach | $753 | $787 | +4.6% |
| 1800 Club | Edgewater | $478 | $499 | +4.4% |
| Biscayne Beach | Edgewater | $814 | $847 | +4.1% |
| Grandview Palace | North Bay Village | $374 | $386 | +3.3% |
| Infinity at Brickell | Brickell | $528 | $538 | +1.9% |
| 50 Biscayne | Downtown Miami | $564 | $569 | +1.0% |
| One Miami | Downtown Miami | $542 | $547 | +1.0% |
| Midtown Doral | Doral | $367 | $367 | +0.1% |

The Pattern Is Not Geographic
If the story were "Brickell is down, Bal Harbour is up," this would be a simpler article. It isn't.
Brickell Key holds both extremes. Carbonell is up 30.7%. Isola is down 9.5% — on the same small island, sharing the same causeway, the same views, the same walk to the same amenities. Whatever separates them, it is not location.
Edgewater does the same thing. Paraiso Bay is up 6.0% and One Paraiso is up 10.5%, while Opera Tower is down 11.2% and Gran Paraiso is down 9.3%. Two of those are in the same master-planned district by the same developer.
Brickell splits four ways. 1010 Brickell is up 20.9%, Skyline up 9.9%, while The Club at Brickell Bay is down 13.8% and Icon Brickell II down 7.5%.
So what actually separates them?
1. Investor concentration
The steepest declines cluster in buildings that were bought heavily by investors for rental yield rather than by owner-occupants. The Club at Brickell Bay, Opera Tower, and Icon Brickell II are all buildings with large studio and one-bedroom counts, high rental turnover, and — critically — a lot of near-identical units.
When forty interchangeable one-bedrooms are listed at once, sellers compete on price against their own neighbors. Buildings with heterogeneous floor plans and more owner-occupants don't generate that kind of internal competition.
2. Unit mix and the small-unit discount
Aventura's Hamptons West, down 20.1%, is the single largest decline in the set. It's an older, large-inventory building where the buyer pool has thinned considerably. Compare it to 2000 Williams Island — same submarket, up 20.1%. A 40-point spread inside one neighborhood, driven by product, condition, and who is shopping for it.
3. Where the 2022 comparison starts
Some of these declines are less about weakness now and more about how hot the 2022 print was. Buildings that were the primary target of the 2021-22 investor rush set a high 2022 median, and measuring from a peak makes ordinary normalization look like a fall. Paramount Miami Worldcenter, down 8.9%, closed a very large number of units into that window.
4. Carrying costs
The buildings holding value best tend to be those where owners aren't being squeezed out by the cost of ownership. Since 2022, Florida condo economics have been reshaped by insurance repricing and by the milestone inspection and structural reserve requirements that followed Surfside. Buildings that funded reserves early absorbed it. Buildings that deferred are now issuing special assessments — and an assessment is a direct, visible deduction from what a buyer will pay.
This is the mechanism most sellers underestimate. A $40,000 assessment doesn't reduce your sale price by $40,000; it reduces it by $40,000 plus the discount buyers apply for uncertainty about whether more is coming.
What This Means If You Own
If you own in one of the declining buildings, the useful question is whether the cause is fixable. Investor saturation and unit-mix problems are structural — they don't resolve because the market improves. Assessment overhang does resolve, once the work is done and paid for, and buildings often re-rate upward afterward.
If you're deciding whether to sell, look at how many units in your own line are currently listed. That number predicts your outcome better than any neighborhood forecast.
What This Means If You're Buying
The declining list is not a list of bad buildings. It's a list of buildings where the price has already adjusted — which, for a buyer with a long horizon and no need to flip, is the opposite of a warning.
The genuinely useful screen is this: a building that fell because it was over-owned by investors in 2022 may now be reasonably priced. A building that fell because it has a structural bill coming and hasn't paid it yet is a different proposition entirely. The distinction lives in the association's financials and reserve study, not in the price history.
Ask for the SIRS, the reserve schedule, the assessment history, and the minutes of the last four board meetings. Then compare the number to this table.
Methodology and Limits
Median closed price per square foot from 72,403 recorded sales, comparing calendar-year 2022 against 2025 and 2026 closings. Buildings need at least 20 closed sales in each window to appear, which is why this covers 39 buildings rather than several hundred — most buildings simply don't transact enough for a median to mean anything.
Three deliberate exclusions worth naming:
- Pre-construction buildings are excluded. Where a tower's 2022 "sales" are developer contract closings and its recent sales are resales, the two numbers measure different things. Waldorf Astoria shows a +97% move on that basis; it reflects pre-construction price escalation, not resale appreciation, so it's out.
- Small samples are excluded, even dramatic ones. Fisher Island's Bayview shows -67% on five recorded 2022 sales. Five sales is not a market.
- Generic building names get extra scrutiny. "Bayview" exists in both Fisher Island and South Beach, and generic names are the most common source of cross-building data contamination in any MLS-derived dataset.
Median price per square foot is a blunt instrument. It doesn't adjust for floor, view, line, or renovation, and a building whose recent sales skewed to lower floors will look weaker than it is. Use this to decide what to investigate, not to price a specific unit.
Related Reading
- Miami Condo Price Per Square Foot: Every Building Ranked
- Miami Condo HOA Fees, Highest to Lowest
- Miami Condo Market Report — July 2026
Data from 72,403 recorded sales through September 2026. Browse every Miami condo building | Contact us
Condo buildings in Brickell
Photos, floor plans, amenities, and current units for sale and rent in each.
- 1010 Brickell
- 1060 Brickell
- 1100 Millecento
- 1550 Brickell
- 2200 Brickell
- 500 Brickell East
- 500 Brickell West
- 619 Brickell (Nobu Residences Miami)
- 888 Brickell by Dolce & Gabbana
- Atelier Residences Miami
- Atlantis on Brickell
- Axis on Brickell North
- Axis on Brickell South
- Baccarat Residences Brickell
- Brickell Arch
- Brickell Bay Club
- Brickell East
- Brickell Flatiron
- Brickell Harbour
- Brickell Heights East
- Brickell Heights West
- Brickell House
- Brickell on the River North
- Brickell on the River South
- Brickell Place I
- Brickell Place II
- Brickell Place III
- Brickell Place IV
- Brickell Ten
- Brickell Townhouse
Tags
Related Articles
Miami Condo Price Per Square Foot: 215 Buildings Ranked (2026)
The median closed price per square foot for every Miami-area condo building with at least five recent sales -- 215 buildings from $3,418 down to $321 plus what the neighborhood medians hide.
Miami Market Report — June 2026: Trophy Neighborhoods, Condo & Home Price Trends
A data-driven mid-2026 look at Miami's trophy neighborhoods — median price per square foot, year-over-year trends, and buyer-vs-seller conditions across Fisher Island, South of Fifth, Brickell, Coconut Grove, Key Biscayne and more.
Miami Condo HOA Fees: 209 Buildings Ranked by Cost Per Square Foot
HOA fees range from $0.75 to $7.34 per square foot per month across Miami condo buildings -- a 10x spread that changes what you can afford far more than the purchase price does. Every building with enough listings to measure, ranked.