Miami Condo Price Per Square Foot: 215 Buildings Ranked (2026)
The median closed price per square foot for every Miami-area condo building with at least five recent sales -- 215 buildings from $3,418 down to $321 plus what the neighborhood medians hide.

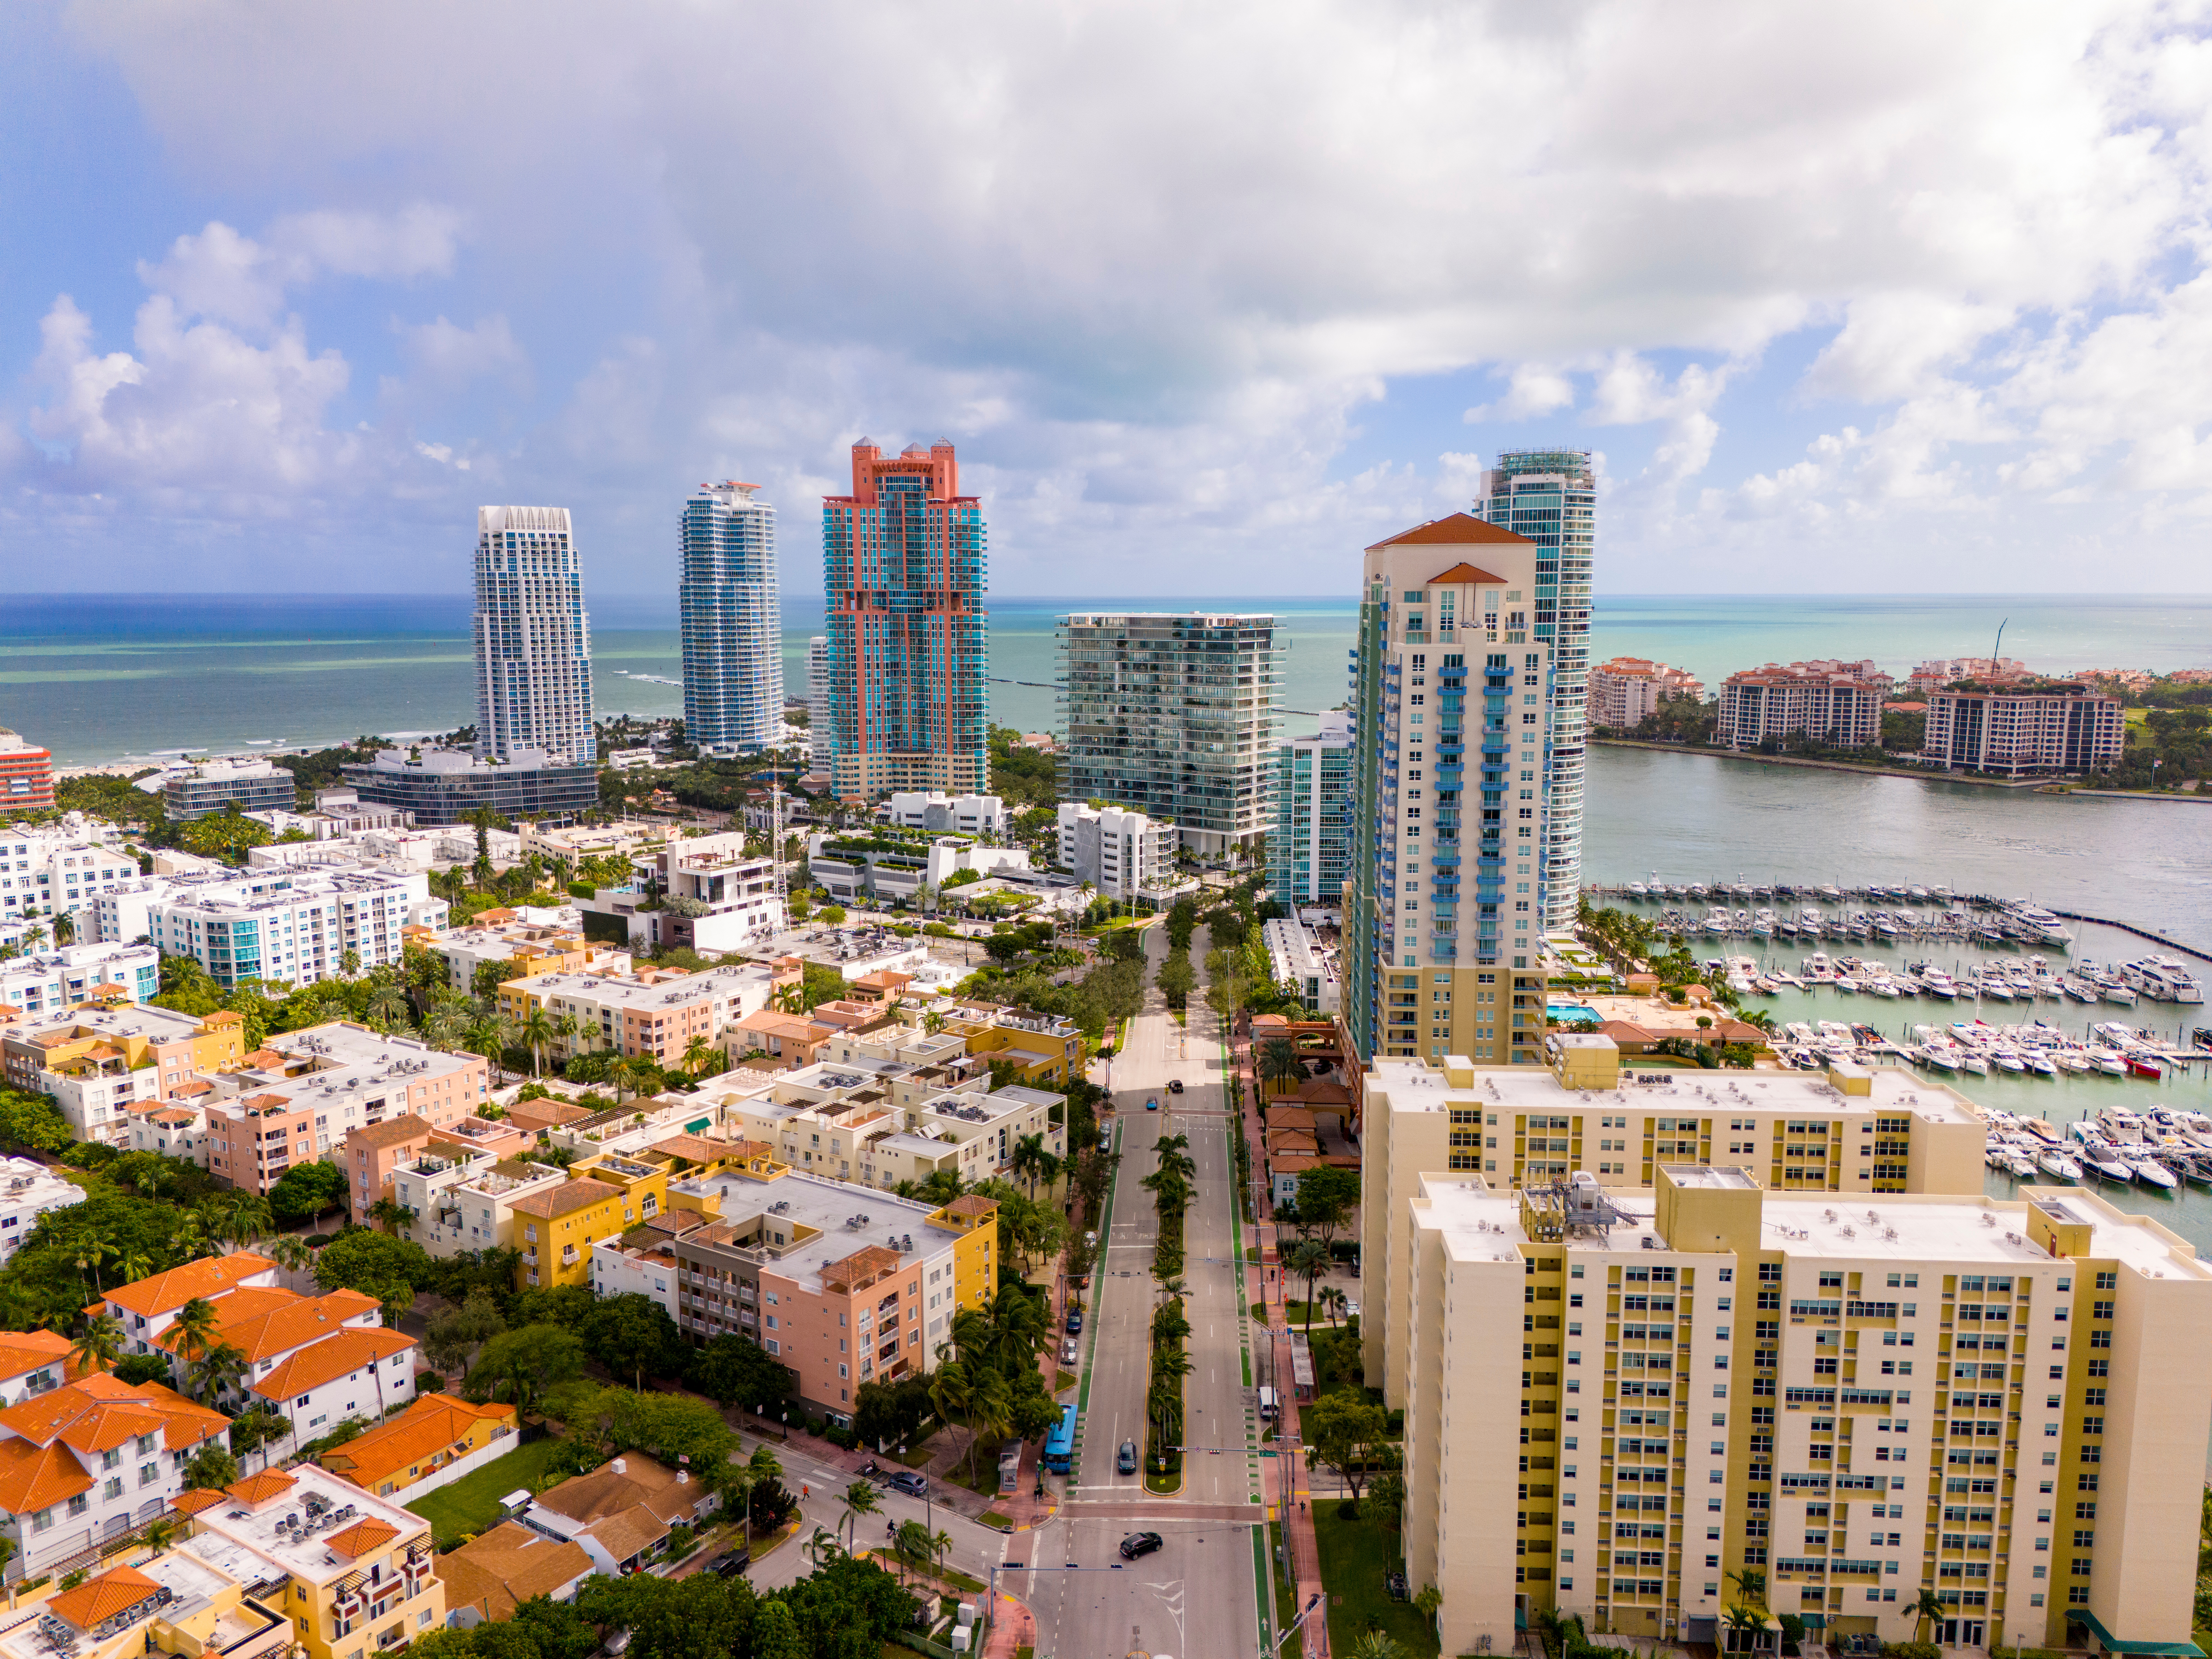
Miami Condo Price Per Square Foot: 215 Buildings Ranked (2026)
Price per square foot is the only number that lets you compare a 900-square-foot Brickell one-bedroom to a 4,000-square-foot Bal Harbour oceanfront unit. It is also the number most often quoted from asking prices, which is a different and much friendlier number than what buildings actually trade at.
This ranking uses closed sales only — what buyers actually paid — for 2025 and 2026 closings, drawn from our recorded sale history. A building appears if it has at least five closed sales in that window. That threshold gives us 215 buildings, spanning $3,418 per square foot at the top to $321 at the bottom, an 11x spread inside one metro area.
The Top 40
| Building | Neighborhood | Median $/sqft | Sales |
|---|---|---|---|
| Apogee South Beach | South of Fifth | $3,418 | 8 |
| Continuum South | South of Fifth | $2,807 | 17 |
| Continuum North | South of Fifth | $2,797 | 9 |
| 1 Hotel & Homes | Mid-Beach | $2,749 | 6 |
| Eighty Seven Park | North Beach | $2,694 | 5 |
| Setai | South Beach | $2,629 | 15 |
| Oceana Bal Harbour | Bal Harbour | $2,534 | 21 |
| The Estates at Acqualina | Sunny Isles Beach | $2,377 | 6 |
| St Regis Bal Harbour Center | Bal Harbour | $2,356 | 6 |
| W South Beach | South Beach | $2,253 | 19 |
| Two Park Grove | Coconut Grove | $2,134 | 11 |
| Mr. C Bayshore Residences | Coconut Grove | $2,127 | 9 |
| Ritz-Carlton Residences Sunny Isles | Sunny Isles Beach | $2,021 | 13 |
| Murano at Portofino | South of Fifth | $2,005 | 10 |
| Five Park | South Beach | $1,917 | 24 |
| Three Hundred Collins | South of Fifth | $1,887 | 5 |
| One Ocean | South of Fifth | $1,885 | 5 |
| Grove at Grand Bay | Coconut Grove | $1,805 | 6 |
| Il Villaggio | South Beach | $1,775 | 6 |
| Armani | Sunny Isles Beach | $1,714 | 7 |
| Jade Signature | Sunny Isles Beach | $1,700 | 16 |
| Monad Terrace | South Beach | $1,658 | 10 |
| Park Grove Club Residences | Coconut Grove | $1,641 | 16 |
| Grovenor House | Coconut Grove | $1,553 | 9 |
| Ritz-Carlton Bal Harbour | Bal Harbour | $1,545 | 5 |
| Muse | Sunny Isles Beach | $1,509 | 6 |
| The Mansions at Acqualina | Sunny Isles Beach | $1,475 | 5 |
| Murano Grande | South of Fifth | $1,438 | 17 |
| Four Seasons | Brickell | $1,430 | 11 |
| Acqualina Resort & Residences on the Beach | Sunny Isles Beach | $1,425 | 18 |
| Majestic Tower | Bal Harbour | $1,398 | 5 |
| Jade Ocean | Sunny Isles Beach | $1,397 | 15 |
| Fontainebleau Tresor | Mid-Beach | $1,367 | 10 |
| Onda Residences | Bay Harbor Islands | $1,365 | 6 |
| Mr. C Tigertail Residences | Coconut Grove | $1,362 | 10 |
| Mei | Mid-Beach | $1,342 | 9 |
| Bath Club | Mid-Beach | $1,327 | 6 |
| Portofino Tower | South of Fifth | $1,325 | 23 |
| Palau | Sunset Harbour | $1,296 | 6 |
| Chateau Beach Residences | Sunny Isles Beach | $1,295 | 7 |
Three things stand out.
South of Fifth owns the ceiling. Apogee at $3,418 and the two Continuum towers above $2,800 sit in a tier of their own. Apogee's number comes from just eight sales, which is worth remembering — in a 67-unit building, eight sales is a meaningful share of the building, but it's still eight data points.
The hotel-branded premium is real and large. 1 Hotel & Homes at $2,749 and Setai at $2,629 both trade far above their neighbors. Some of that is the brand; a good deal of it is that hotel-condos can generate income their neighbors legally cannot, and that optionality is priced in. Both appear on our list of buildings that allow short-term rentals.
Coconut Grove has quietly become expensive. Two Park Grove at $2,134 Mr. C Bayshore at $2,127 Grove at Grand Bay at $1,805 and Grovenor House at $1,553 put a mainland neighborhood into oceanfront territory.
The Bottom 20
| Building | Neighborhood | Median $/sqft | Sales |
|---|---|---|---|
| Hamptons West | Aventura | $321 | 23 |
| Aventura Marina 1 | Aventura | $327 | 6 |
| Alaqua | Aventura | $329 | 14 |
| Turnberry Isle | Aventura | $340 | 27 |
| One Island Place I | Aventura | $367 | 5 |
| Midtown Doral | Doral | $367 | 21 |
| Grandview Palace | North Bay Village | $386 | 24 |
| Venetia | Downtown Miami | $387 | 23 |
| Hilton Grand | Edgewater | $393 | 8 |
| Rosewood Residences | South Beach | $400 | 9 |
| Aventura Marina 2 | Aventura | $404 | 9 |
| Charter Club | Edgewater | $411 | 11 |
| Cite on the Bay East | Edgewater | $415 | 10 |
| 1800 Biscayne Plaza | Edgewater | $421 | 12 |
| Gables Marquis | Coral Gables | $428 | 13 |
| 2000 Williams Island | Aventura | $434 | 49 |
| Opera Tower | Edgewater | $436 | 40 |
| Brickell Place II | Brickell | $436 | 13 |
| The Atrium at Aventura | Aventura | $439 | 14 |
| Fortune House | Brickell | $447 | 7 |
Aventura dominates the bottom of this list, and it deserves context rather than a verdict. The neighborhood's inventory skews toward large, older buildings with big floor plans — and price per square foot is systematically unkind to large units. A 2,200-square-foot unit at $329 per foot is a $724,000 apartment. That is not a cheap home; it is a big one, priced by the foot.
The same effect explains Turnberry Isle and Hamptons West at the bottom. Both also appear among the buildings that have lost value since 2022, which is the more meaningful signal.
One number here should be treated with suspicion: Rosewood Residences at $400 per square foot across nine sales. That is far below where Rosewood-branded product trades, and "Rosewood Residences" is a name shared across more than one South Florida project. Generic and shared building names are the most common source of contamination in any MLS-derived dataset, and this looks like a case of it. We're leaving it in with the flag rather than silently deleting it.

By Neighborhood
Neighborhood medians, computed from the building medians above. Only areas with at least three qualifying buildings appear.
| Neighborhood | Median $/sqft | Buildings |
|---|---|---|
| South of Fifth | $1,885 | 11 |
| Coconut Grove | $1,641 | 7 |
| South Beach | $1,337 | 10 |
| Mid-Beach | $1,335 | 6 |
| Sunny Isles Beach | $1,114 | 21 |
| North Beach | $1,107 | 3 |
| Bal Harbour | $1,009 | 9 |
| Sunset Harbour | $968 | 3 |
| Venetian Islands | $824 | 5 |
| Fort Lauderdale | $730 | 5 |
| Hollywood Beach | $710 | 3 |
| Surfside | $692 | 4 |
| Brickell Key | $682 | 10 |
| Downtown Miami | $616 | 12 |
| Coral Gables | $595 | 6 |
| Brickell | $582 | 46 |
| Edgewater | $576 | 26 |
| Aventura | $460 | 18 |
Read this table carefully, because it is the most misleading one on the page.
Coconut Grove sits second at $1,641 — from seven buildings. All seven are recent trophy product. The Grove also contains a great deal of older, more modest inventory that doesn't clear the five-sale threshold. The median describes the buildings that qualified, not the neighborhood.
Brickell at $582 across 46 buildings is the most trustworthy number in the table, simply because it rests on the most buildings. Same for Edgewater at $576 across 26 and Sunny Isles Beach at $1,114 across 21.
The general rule: the more buildings behind a median, the more it describes an actual market rather than a handful of towers.
What Price Per Square Foot Doesn't Tell You
It is a screening tool. It is not a valuation.
It ignores floor and view. In an oceanfront tower the spread between floor 4 and floor 40 in the same line can exceed 60%. A building's median reflects whichever floors happened to trade.
It ignores carrying cost entirely. Two buildings at $700 per square foot are not equivalent when one charges $1.10 per foot per month in HOA and the other charges $3.40. Over a decade the difference exceeds the purchase price gap. We ranked that separately in Miami condo HOA fees by building.
It ignores what's coming. A building with an unfunded structural reserve and a pending assessment will show a normal price per square foot right up until the assessment is announced. Florida's milestone inspection and SIRS requirements have made this the single most important thing to check that a price chart cannot show you.
It ignores renovation. A gut-renovated unit and an original-condition unit in the same line trade hundreds of dollars per foot apart and land in the same median.
How to Actually Use This
Use it to ask better questions:
- Compare within a neighborhood, not across. $700 per foot means something different in Sunny Isles than in Aventura.
- When a building is far off its neighbors, find out why. Usually it's age, unit size, or carrying cost — occasionally it's a data artifact like the Rosewood entry above.
- Pair it with the trend. A building at $600 and rising is a different asset from a building at $600 and falling.
- Then read the association's financials. Every time.
Methodology
Median closed price per square foot from recorded sales closing in 2025 and 2026. Minimum five closed sales per building. Sales with missing or implausible square footage are excluded, as are price-per-foot values below $50 or above $15,000. Neighborhood medians are medians of the qualifying building medians, not of individual sales, so each building counts once regardless of size. Data current through September 2026.
Related Reading
- Which Miami Condo Buildings Lost Value Since 2022
- Miami Condo HOA Fees: Highest and Lowest
- Miami Condos That Allow Short-Term Rentals
- Miami Condo Market Report — July 2026
Browse every Miami condo building | See what's for sale | Contact us
Condo buildings in South of Fifth
Photos, floor plans, amenities, and current units for sale and rent in each.
- 321 Ocean
- Apogee South Beach
- Continuum North
- Continuum South
- Glass
- Hilton Bentley
- ICON South Beach
- Louver House
- Marea
- Murano at Portofino
- Murano Grande
- Ocean House
- Ocean Park South Beach
- Ocean Place
- Ocean Walk on South Beach
- One Ocean
- Portofino Tower
- South Pointe Towers
- The Cosmopolitan
- The Mercury South Beach
- Three Hundred Collins
- Yacht Club at Portofino
Tags
Related Articles
Which Miami Condo Buildings Lost Value Since 2022 (And Which Gained the Most)
We compared closed sale prices per square foot in 2022 against 2025-26 closings across 72,403 recorded sales. Twelve buildings with deep transaction histories are down, twenty-seven are up, and the dividing line is not the neighborhood.
Miami Market Report — June 2026: Trophy Neighborhoods, Condo & Home Price Trends
A data-driven mid-2026 look at Miami's trophy neighborhoods — median price per square foot, year-over-year trends, and buyer-vs-seller conditions across Fisher Island, South of Fifth, Brickell, Coconut Grove, Key Biscayne and more.
Branded Residence vs Luxury Condo in Miami: We Measured the Premium
Branded residences in Miami ask 97% more per square foot than unbranded condos -- $1,541 against $782, measured across 3,754 live listings. But in two neighborhoods the premium is zero or negative. Here is where the badge is worth paying for and where it is not.